5 Limits to GDP & alternative measures
5.1 About this chapter
We will now follow up on some of the issues on measuring well-being raised in the last chapter. In the last chapter we learned how GDP is a measure of economic activity and how it is (mis)used as a measure of well-being. In this chapter we discuss the problems with using GDP as a well-being measure, what well-being is, and how we can measure it.
5.1.1 Intended learning outcomes
After reading this chapter you should be able to:
- Explain the problems of using GDP as a well-being measure.
- Explain and identify subjective and objective measures of well-being.
- Use publicly available measures of well-being and explain how they are created and relate to each other.
- Use scatter plots and understand how we can combine several variables in one measure.
5.2 The limits of GDP
Based on last chapter’s explanation of what GDP is and what it isn’t we can already list some limitations.
*DP only measures market activities. Recall the economy of Microeconomy. If the farmer produced the same flour, but didn’t sell it to the bakery, but instead made bread at home, the bread would not be included in GDP, even though the actual output in terms of bread (assuming the farmer is as good a baker as the baker) is the same! In a situation like the COVID-19 pandemic, where we cannot go to shops like normal, we might increase our home production and reduce our market activities. This will lead GDP to fall.
It is unclear what activities are included. As discussed in the last chapter there is a greyzone of activities that could be included in GDP. This area reduces the comparability across regions and time.
These limitations relate to GDP as a measure of economic activity. However, GDP (per person) is mostly criticized for being a poor measure of well-being. That is understandable, because such a measure would assume that (market) economy activity equals well-being. That is not necessarily the case.
5.3 What is well-being?
One of the reasons for why the GDP is so popular is that it has a more or less globally accepted standard way of quantifying economic activity. Very few variables are as standardized as GDP (although there are some variation in what is included in the GDP measure). We use GDP because the GDP is available and because the GDP is comparable across countries and regions. Not even definition of unemployment rate is as standardized as the measure of GDP. But we now know what the GDP captures and what should use it for and what we shouldn’t use it for. It is a measure of economic activity, not a measure of well-being. But what is well-being? What is welfare?
The first challenge is to agree on what we want to measure and what we want to call it. Is it well-being, happiness, welfare or quality of life. The “Stiglitz report”5 (discussed below) uses the term “Quality of Life” and states the following:
“While a long tradition of philosophical thought has addressed the issues of what gives life its quality, recent advances in research have led to measures that are both new and credible. This research suggests that the need to move beyond measures of economic resources is not limited to developing countries (the traditional focus of much work on human development in the past) but is even more salient for rich industrialised countries. These measures, while not replacing conventional economic indicators, provide an opportunity to enrich policy discussions and to inform people’s view of the conditions of the communities where they live. More importantly, the new measures now have the potential to move from research to standard statistical practice. While some of them reflect structural conditions that are relatively invariant over time but that differ systematically across countries, others are more responsive to policies and more suitable for monitoring changes over shorter periods of time. Both types of indicator play an important role in evaluating quality of life.
We will go through the three conceptual approaches discussed in the Stiglitz report below and later present some measured of quality of life and well-being in practice and how they relate to the conceptual approaches.
5.4 GDP and well-being
The Stiglitz Report
One important milestone in the debate on measuring well-being and quality of life is the so called “Stiglitz Report,”7 named after one of the authors, professor Joseph E. Stiglitz. The official title of the report is “Report by the Commission on the Measurement of Economic Performance and Social Progress”. The goal of the commission behind the report was
“to identify the limits of GDP as an indicator of economic performance and social progress, including the problems with its measurement; to consider what additional information might be required for the production of more relevant indicators of social progress; to assess the feasibility of alternative measurement tools, and to discuss how to present the statistical information in an appropriate way.”
page 7 in.8
The report provides detailed examples and criticism of GDP as a measure of well-being and social progress as well, as discussed, conceptual approaches to measure well-being. We will first briefly discuss some of the most prominent criticism of GDP as a measure of well-being and then return to how we could do a better job.
Criticism of GDP as a well-being measure
-
GDP is a poor measure of human welfare
The first criticism is probably the most-known critique: GDP measures consumption of goods and services (the expenditure approach), and while these aspects might be correlated with quality of life, there are many aspects of utility and well-being that are not captured by GDP. To list a few:
- Nature and environment (pollution)
- Education
- Health
- Crime and safety
Consider two countries that have an identical GDP per capita. In the first country there is almost no pollution, there are beautiful mountains, forests, lakes and beaches. In the second country there is lots of pollution and no access to nature. Moreover, in the first country life expectancy is high and the population have very few health problems. In the second country life expectancy is low and the mental and physical health of the population is very low.
Would you say that well-being is the same in the two countries (they have the same GDP per capita)? Probably not. And GDP per capita does not capture all these elements listed above (and many elements we did not list).
Many studies find that GDP per capita is correlated with the dimensions above. For example that higher GDP capita is associated with lower infant mortality rates. But this is not the case for all dimensions, and the question is whether it is sufficient that GDP is correlated with these aspects.
-
GDP ignores the distribution
Again, consider two countries with identical GDP per capita. In the first country, some have a bit more resources than others, but very few are poor and very few are extremely rich. In the second country all inhabitants are poor, with the exception of one extremely rich person. Is the well-being the same these two countries?
In practice we often observe GDP growth rates that affect the population unevenly. The well-educated population may benefit more from growth driven by advanced innovation than unskilled workers. The GDP per capita measure does not capture these distributional effects. Recall from the last chapter that Kusnets already mentioned the issue of not accounting for the distribution of income.9
-
Well-being is not monotonically increasing
Does GDP growth always make people happier? And is the effect constant? Promoting GDP growth appears to be an endless goal, but in practice, the effect of more GDP on well-being might non-linear and even non-monotonic. Going from starvation to having enough food and decent living conditions might affect well-being more than the same monetary increase for people who already have very high living standards. Moreover, there might be some certain level of saturation, after which more GDP does not lead to increases in well-being.
Some evidence suggests that after a certain level resources, people care mostly about their relative position. This is phenomena called “keeping up with the Joneses”, where we envy those who have more than us, and enjoy looking at those who have less than us. In such a case, a uniform increase in income for all of us has no effect on the well-being.
5.5 How to measure well-being & quality of life
Recommendations from the Stiglitz report
The commission identified the following three conceptual approaches to measuring quality of life:
-
Subjective well-being
The key idea is that we simply ask people about their well-being and happiness with the idea that: “that enabling people to be happy and satisfied with their life is a universal goal of human existence.” from page 7 in10
There are several standardized questionnaires to capture the measures above and many of them show consistent patterns:
“Research has shown that it is possible to collect meaningful and reliable data on subjective well-being. Subjective well-being encompasses different aspects (cognitive evaluations of one’s life, positive emotions such as joy and pride, and negative emotions such as pain and worry): each of them should be measured separately to derive a more comprehensive appreciation of people’s lives. Quantitative measures of these subjective aspects hold the promise of delivering not just a good measure of quality of life per se, but also a better understanding of its determinants, reaching beyond people’s income and material conditions.”
page 58 in11
-
Capabilities
The second conceptual approach to measuring well-being is to measure individuals ability to pursue and realise the goals that they value (the capabilities).
-
Fair allocations
The third conceptual approach to measuring well-being is to measure the allocation of resources among people with different tastes and abilities.
Operationalizing well-being measures
Subjective well-being measures
Subjective well-being measures are often divided into the following three types:
Evaluative measures In this approach we ask respondents to evaluate their life satisfaction, their health, or in general their well-being. We can anchor these questions (“relative to the best possible state” or relative to some objective state.).
-
Experience measures
In this approach we ask respondents about their feelings or experiences at specific points during the day (or during the week).
-
Eudemonic measures
This approach focuses on psychological aspects of individual well-being and relates to the individual’s position and control over their life.
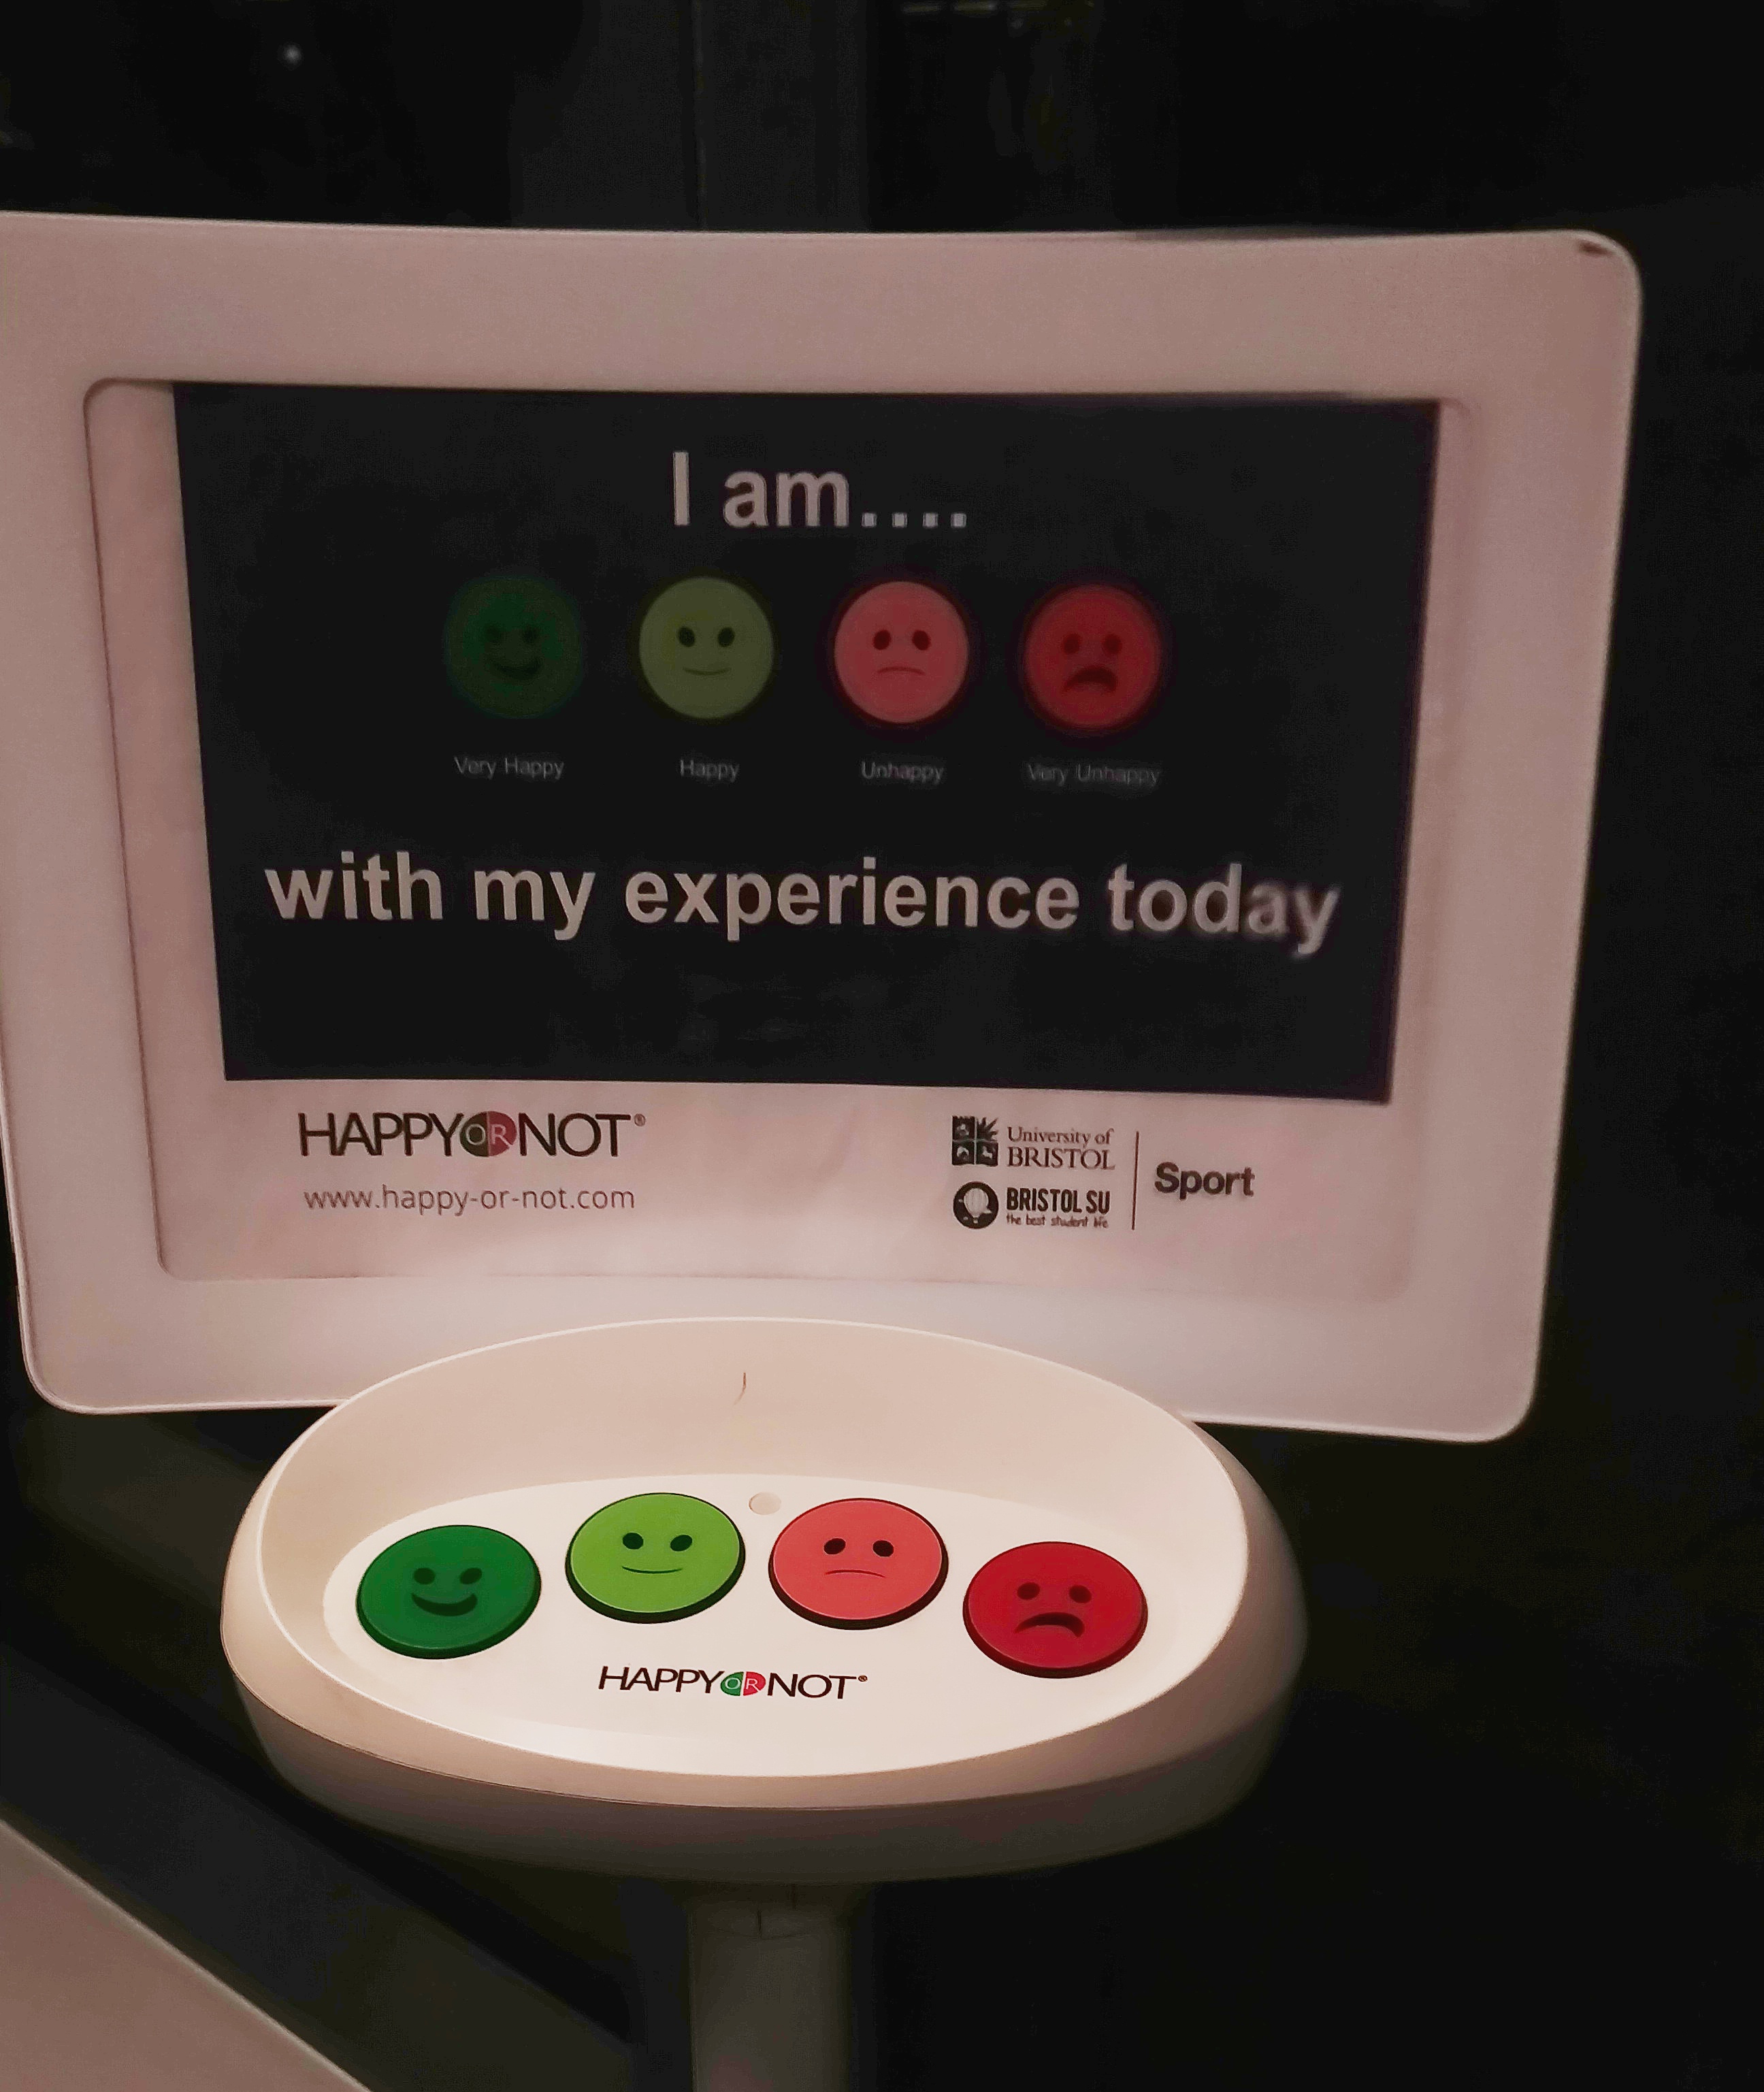
Figure 5.1: Ask people how they feel
“Objective” well-being measures
While subjective well-being typically is measured through questionnaires where we directly ask people about their their well-being, the capabilities and fair allocations approaches typically rely on “objective measures”. However, these approaches should not be considered as “more objective” compared to the subjective measures. For example the choice of indicators to include depend on a normative judgement.
“The information relevant to valuing quality of life goes beyond people’s self-reports and perceptions to include measures of their functionings and freedoms. While the precise list of these features inevitably rests on value judgements, there is a consensus that quality of life depends on people’s health and education, their everyday activities (which include the right to a decent job and housing), their participation in the political process, the social and natural environment in which they live, and the factors shaping their personal and economic security. Measuring all these features requires both objective and subjective data. The challenge in all these fields is to improve upon what has already been achieved, to identify gaps in available information, and to invest in statistical capacity in areas (such as time-use) where available indicators remain deficient.”
page 58 in12
5.6 Measuring well-being in practice
Let us now discuss approaches to measuring well-being in practice and how they relate to the approaches discussed above.
Quick introduction: reducing dimensionality
How can we create a well-being measure that combines measures of subjective well-being, measures of health, education, environment, crime in one statistic?
When working with topics such as global development or well-being, we are often interested in aggregating several variables to obtain one variable. Many of the strategies to achieve this are beyond the scope of this unit, but you should be aware of these methods.
-
Creating an index
Well-being measures such as the Human Development are s based on aggregating three individual indices by means of the geometric mean.
\[\begin{align} HDI=(LEI\times EI\times II)^{1/3} \end{align}\]
Where \(LEI\) is the life expectancy index, \(EI\) is the education index, and \(II\) is the income index. Each of these indices are measured on a scale from 0 to 1, where the raw variables are related to some “max” value. For example for life expectancy, the maximum is 85 (i.e. an index value of 1) and the minimum is 20 (i.e. an index value of 0). A standard formula of measuring the individual index is as follows:
\[\begin{align} I=\frac{Y-Y_{MIN}}{Y_{MAX}-Y_{MIN}}. \end{align}\]
To create an index, just like the HDI, we therefore first convert each variable to be on a scale between 0 and 1 using the formula above, and we then compute the geometric mean across all Indexes \(i\):
\[\begin{align} \text{Aggregate Index}=\left(\prod_{i=1}^N I_i\right)^{1/N} \end{align}\]
- Principal Component Analysis and Factor Analysis
Principal component analysis (PCA) and Factor analysis are methods to reduce the dimensionality of data. These approaches are very often used in regressions, when you want to reduce the number of variables. With these method you can identify a set of or that describe the variation in the data. The goal is typically to identify a set of components and factors that are smaller than the number of variables used.
Intuitively speaking, the goal is to identify variables that “move in the same direction”. Imagine that you have a dataset with 25 behavioural measures of a child. Five of these measures relate to the child’s peer relations. When one of these variables go up, the other four also tend to go up. Another five variables might capture the child’s level of hyperactivity and inattention, again, if one of the five variables goes up, the other four also tend to go up. We have those identified two separate components, that each cover five underlying variables.
Factor analysis and principal component analysis are two distinct methods. Factor analysis is more based on theories of underlying latent (unobserved) variables, while principal component analysis is more based the objective to reduce the number of dimensions (number of variables) in the data.
Because well-being depends on several aspects, such as health, environment, income and education, it is hard to compare across time and space. There are simply too many “dimensions”. We would like to reduce the well-being to one variable, to one dimension. There are several approaches to combine several variables in one variable. The following two methods are very common:
- An index based on a geometric mean
- Principal component analysis
The Human Development Index (UN)
The Human Development Index (HDI) is developed by the United Nations Development Programme (UNDP). The index is an example of combining several objective indicators of well-being in one measure. The index consists of the three dimensions:
- Life expectancy index
- Education index
- Income index.
the HDI is created by the geometric mean of the the three indices above. There ahas been some changes in the HDI definition over time. Data is available for the period 1995-2015 for many countries across the world. The data can be downloaded from the website of the United Nations: UN.
World Happiness Report
Published by the United Nations since 2012, the World Happiness Report uses data from the Gallup World Poll to describe global happiness patterns, by linking these data to specific topics (for example migration). The data is available for download here: World Happiness Report.
OECD Better Life Index
The OECD has computed the “Better Life Index” since 2013. The index is a combination of subjective and objective indicators that captures 11 dimensions of well-being: housing, income, jobs, community, education, environment, civic engagement, health, life satisfaction, safety and work-life balance. The data is available both as a total, by subgroups (men and women) and by distribution (low vs. high). The data can be downloaded from the OECD website: OECD.
ONS Measuring National Well-being
The UK office for National Statistics collects data on well-being measures. These data are a combination of subjective and objective indicators and capture personal well-being, relationships, health, what we do, where we life, personal finance, the economy, education and skills, governance, and the natural environment. The data is available both on aggregated level, and also on a regional level from the ONS website: ONS.
Quality of life indicators
Eurostat publishes various statistics related to quality of life. They have identified nine indicators to capture quality of life. These aspects are also a mix of subjective and objective indicators. A description of their approach and links to data is available here: eurostat.
Why is the GDP used anyway?
Why is GDP so important in policy making despite the criticism above? First of all, as disucssed above. GDP has the advantage of being available and being standardized. Secondly, it is correlated with many of the well-being measures discussed above. In Figure 5.2 we combine data on GDP per capita and the quality of life measures from Eurostat. What do you think of relationship? Do you recognize any of the criticism of GDP as a well-being measure?
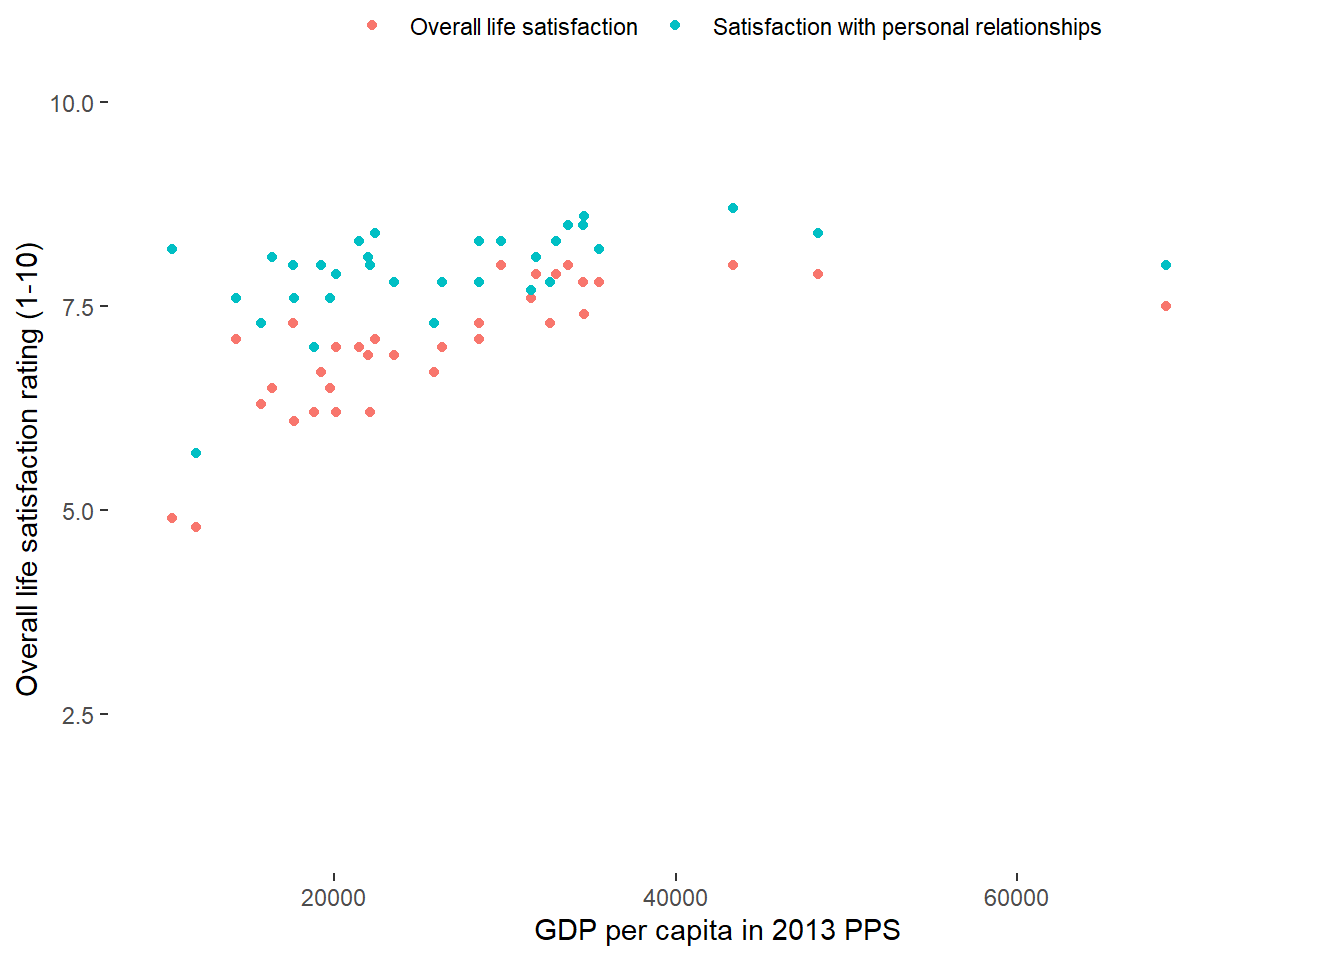
Figure 5.2: Figure 1: GDP per capita and subjective well-being in 2013. Source: Eurostat
To assess the relationship between the two variables, GDP per capita and Subjective Well-Being we used a scatter plot. A scatter plot is like an unconnected line chart where the vertical and horisontal positions represent the values of respectively the variables on the vertical (y) axis and horisontal axis (x). Scatter plots are very powerful tools to show relationships between variables, especially when we have a lot of data.