7 Poverty
7.1 What this chapter is about
In the last chapter we discussed how we could quantify the distribution of resources. This chapter is about quantifying the degree of poverty.
7.2 Measuring global development
Quantifying global development is a challenging task. First, it is challenging to obtain data covering the globe. Administrative data is only available for a small number of selected countries, global censuses would be very expensive, and it is challenging to create representative surveys across the world (but it is done). Second, as we already discussed, even within one single country, there is a lot of work involved in measuring and standardizing concepts such as unemployment and GDP. Third, countries differ substantially in their institutional setting.
Despite these challenges, we have quite good indicators of the direction of global development. Let us consider the graphs from Our World In Data shown Figure 7.1 (again). What data is required to create these charts? Poverty measures, education measures, literacy rates, democracy, vaccination data, and child mortality rates. None of these variables are easy to collect, and behind these simple illustrations of global development there is an enormous amount of work. To get an idea of the amount of work, you can go to the website of the source ourworldindata.org, and search for one of these indicators. You will find that all these Figures are based on an extensive set of sources.
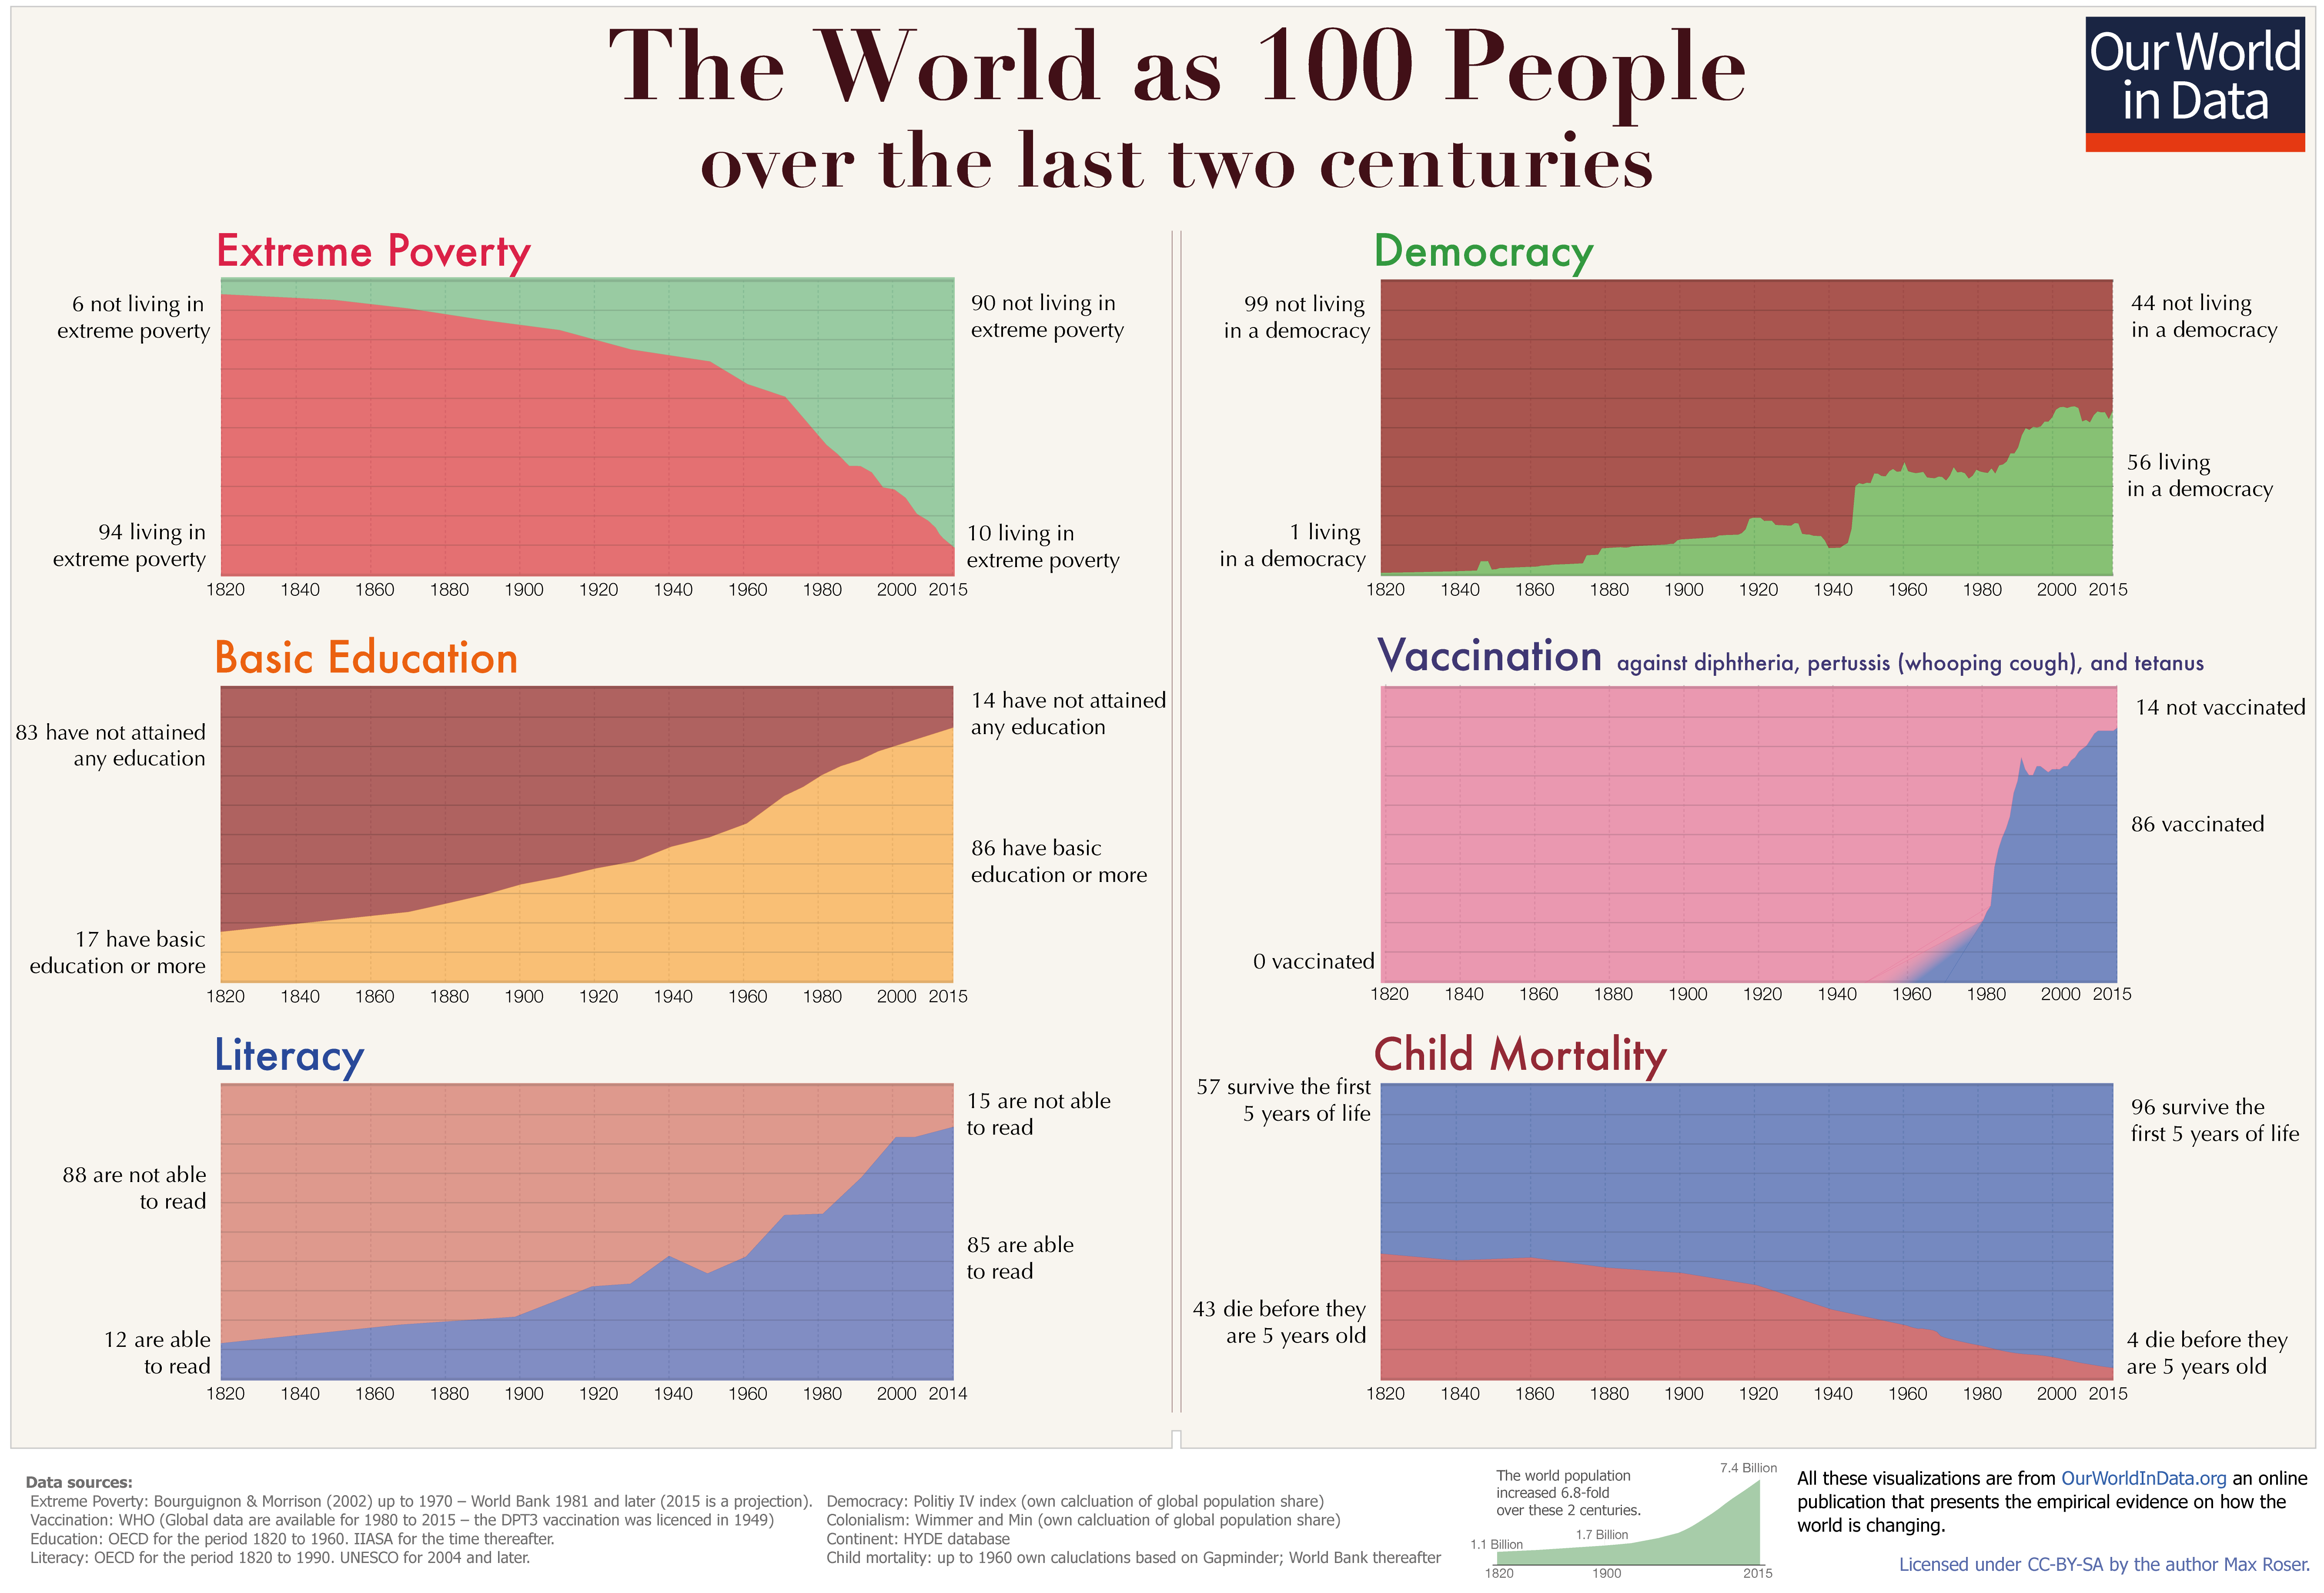
Figure 7.1: The world as 100 people. Source: Our World in Data.
But measuring global development is not only challenging because it is difficult to obtain the important variables. It is also challenging, because it is difficult to decide which variables we should focus on. Figure 7.1 does, for example, not include any measures on crime, environment or corruption.
One approach to deciding which measures to include is to focus on variables that capture stated policy targets. At the United Nations Millennium Summit in 2000, all member states committed to the eight Millennium Development Goals (MDG). These eight goals were all linked to specific target dates. Should we just measure progress on these stated goals and follow global development? This is not ideal, as these goals are not linked to any analytical framework or economic principles. And even given these goals, it is unclear how to measure each goal. How would you for example measure “Global Partnership for Development”? The MDG were replaced by the 17 Sustainable Development Goals (SDQ) in 2015 with a target of achieving these goals by 2030.
Compared to the MDG, the SDQ headlines are somewhat more general, but SDGs are linked to 169 specific targets with concrete indicators. For example behind the first goal, “No Poverty”, there are four targets. You can read about all 169 indicators on the following website: globalgoals.org.
7.3 Measuring poverty
Eradicating poverty was the first goal both in the MDG and SDG list. Global development in poverty is also the first statistic shown in Figure 7.1. This is no surprise: Poverty is a core measure of global development. And even though numbers have improved substantially, we still observe that 1 out of 10 people live in extreme poverty. This is much better than when I was born, where 4 out of 10 people lived in extreme poverty, or in the 1960ies when more than 6 out of 10 people lived in extreme poverty. But how do we define poverty?
The poverty line is the core of defining poverty. People below this line are defined as being poor, people above this line are defined as non-poor. The line thereby represents a threshold, below which an “acceptable” life is not possible. One way to define this level is to quantify the food intake required for an adequate diet (say 2000-2500 calories per day for an adult), and calculate the costs of this intake. To this we would add the costs of shelter and clothing. People with a consumption below this level or an income below this level are then defined as being poor. The level will differ substantially from country to country. Moreover country differences in institutional settings also affect which other factors we would consider important. For example, is health care publicly provided or should that be included in minimum cost calculation?
Basing poverty levels on the minimum costs for an adequate food intake is actually not uncommon. The official poverty measure in the US is for example based on estimates from the 1960ies, based on the cost of a minimum food diet.14
An alternative to minimum costs of diet based measures is a relative poverty line, where we specify the poverty line relative to the income distribution in the country, for example by defining households with an income less than 60 percent of the median income as in poverty. Below we’ll discuss some of the key issues in measuring poverty.
Income or consumption?
We could define poverty both by what individuals and households consume and by their consumption possibilities, i.e. their income. Observing actual consumption is much harder than observing income, which makes the latter approach much more attractive because it is based on a practical point of view. Moreover, if an individual had the option to consume a sufficiently healthy diet, but for some reason decided not to, should this person be defined as poor? Moreover, actual nutritional intake might not be monotonically increasing in expenditure. Some more expensive and enjoyable food might have a lower nutritive value. So in practice, poverty measures based on income are much more common than poverty measures based on consumption.
Relative or absolute measures?
Given the introduction above, an absolute level of income seems like a natural threshold for poverty. Below this line, a household cannot afford sufficient nutrients, cannot afford to buy clothing and cannot afford shelter. Such an absolute poverty line is based on what is “required to survive”.
An alternative approach is to think of a poverty line reflecting the ability to participate in society. What is required to participate in the society will vary from country to country. In some countries owning a means of transportation might be crucial, in other countries access to the internet might be more important. Identifying the exact level of income necessary for participating in the society is very difficult. Instead, we can define the poverty threshold relative to the median income in the economy.
It is important not to define poverty by the mean of the income distribution, because this would imply that if an extremely rich person moves out of the country, the poverty rates would be reduced considerably. Finally, it is important to stress that relative poverty measures never can replace absolute measures completely. At some low level of median income the relative poverty line might be below the absolute poverty line and thereby not allow people to survive.
Poverty definitions
The OECD Definition
The OECD defines people as being in poverty if their income is less than 50 percent of the median income.
The EU Definition
- The EU defines people as being in poverty if their income is less than 60 percent of the median income. The group of people below this threshold are defined as being “at-risk-of-poverty”.
Extreme Poverty
- The concept of “Extreme Poverty” was introduced by the United Nations in mid 1990ies. This definition is an absolute measure of poverty, and refers to the minimum level of income that a person needs to survive. This poverty measure is known as the “1 dollar a day” measure. The 1 (US) dollar a day refers to the 1996 price level in the US. In terms of 2005 price levels the threshold is 1.25 USD a day. This is the measure used in the Figure
UK poverty measures
- Various poverty measures are in use and have been used in the UK. In the Child Poverty Act of 2010, an income of 60 percent of the median income is used. The Joseph Rowntree Foundation has defined a minimum income standard, which is “based on what people think is required for an acceptable living”. In 2016 the minimum income standard threshold for a single person was 17,100 GBP (before taxes). For two adults with two children, the threshold was 37,600 GBP (total across the two parents).
Other indicators
There are a wide range of poverty definitions and indicators in addition to those discussed above. Some of these indicators have very different approaches to measuring poverty. One alternative is the Multidimensional Poverty Index, which is based on ten indicators covering schooling (years of schooling and school attendance), child mortality, nutrition, electricity, sanitation, drinking water, the condition of the floor, cooking fuel, and assets.
For each person, a weighted average (measured in terms of percentages) across these indicators is constructed and added. The total index is then the product of the number of people who are poor and the intensity.
7.3.1 Challenges with poverty line
Poverty lines are very useful because they allow us to track progress, however, poverty lines can also be “dangerous”, as they might lead policymakers to focus on people close to the line, while ignoring people far away from the line, because they will have a lower impact on the numbers. However, people further below the poverty line might need support more than those just below the poverty line.